Chapter 30: Verifying Against a Reference Implementation
Part VI — Data, Reproducibility & Verification
What runs here
The runnable cells clone two public benchmark repositories at their released tags and run one small case of each, a few seconds apiece; they need network access to GitHub. Regenerating the TerraME references themselves needs Docker and is shown as commands.
Learning Objectives
By the end of this chapter you will be able to:
- Explain why the ecosystem is checked against TerraME and LuccME, which remain the reference, and what such a check can and cannot show
- Regenerate reference outputs from a container pinned by digest, and compare them by hash or by tolerance
- Read a difference between two implementations as class A, B or C, and tell a regression criterion from an equivalence tolerance
- Recognize the documented causes of difference between DisSCube's operators and TerraME's
fill - Run a spatial and a dynamic benchmark yourself, and report a difference you cannot explain
# Standard imports
import subprocess
from pathlib import Path
import numpy as np
import matplotlib.pyplot as plt
Chapter 29 made every run leave a record that someone else can check. A record proves which code ran on which input; it does not prove that the code computes what it should. For the DisSModel ecosystem a natural yardstick already exists: TerraME and LuccME, whose outputs have backed land-use studies in Brazil for years. This chapter shows how DisSCube and DisSLUCC are checked against them, stage by stage, and — just as important — how to report the places where the two disagree.
Why a Reference Implementation
Writing a model again in another language invites a specific failure: the new code runs, produces plausible maps, and quietly computes something slightly different. The only way to catch that is to run the old and the new on the same inputs and compare. Three decisions shape how the ecosystem does it.
- The original stays the reference. The comparison asks whether the Python components behave like TerraME and LuccME, not whether they are better. Where they differ for a documented reason, the reason is stated; where a difference cannot be explained, it is reported as open, and the TerraME values remain the reference.
- Each stage is checked on its own. The data preparation (TerraME's
fill, DisSCube's operators) and the dynamics (LuccME's components, DisSLUCC's) are compared separately, on small cases where every cell can be inspected, before anything is run at scale. A disagreement in a complete model is hard to locate; a disagreement in one operator on 620 cells is not. - The evidence lives outside the packages. The references and the benchmarks are separate, public repositories, each released with a DOI, so that the packages cannot quietly change their own yardstick.
What such a comparison is not deserves saying as clearly. It is neither replication nor validation in the sense of Chapter 29: agreement with TerraME shows that the components behave like TerraME, not that TerraME's behavior is right, nor that a model built with them describes any real landscape.
A Reference You Can Rebuild
TerraME 2.0.1 depends on a runtime from Ubuntu 18.04 and may not build on a current system. The first piece of the chain is therefore a container image with TerraME and LuccME inside, terrame-docker, published on Docker Hub as profsergiocosta/terrame-luccme and identified not by its tag — a tag can be moved — but by its digest:
profsergiocosta/terrame-luccme@sha256:e0f46a7faed8a601c2ca10f3ba0dcebb352b13b8361e40d6580a0a034c21fb2c
The second piece is luccme-goldens, which holds the outputs TerraME and LuccME produced in that image — the goldens — together with the scripts and input layers that produced them, each file with its SHA-256:
- the outputs of TerraME's
filltutorial cases (Itaituba, Legal Amazon, Emas National Park, a majority-class case) and of a national connectivity case; - the 21 test labs that ship with LuccME 3.1, at the last year and year by year, with the number of iterations TerraME needed in each year.
Benchmarks download the goldens from an immutable release tag and check each hash before computing anything.
E1: Regenerating the References
A reference is only as good as the claim that it can be produced again. With Docker installed, the regeneration is a few commands:
git clone https://github.com/LambdaGeo/luccme-goldens.git && cd luccme-goldens
make run-fill DOCKER_IMAGE=profsergiocosta/terrame-luccme@sha256:e0f46a7f…   # TerraME fill cases
make run-labs-per-year                                                       # the 21 labs, year by year
make check                                                                   # compare with the archive
Regenerating everything with image 0.4.2 changed no tracked file of the fill cases or of the final-year labs. Of the 23 per-year outputs (21 labs and two variants), 21 were byte-identical; the other two — lab01 and its variant — differed in a single value, in the twelfth decimal place, the last digit the CSV prints. Eight consecutive runs of lab01 on the same machine, in the same container, gave several different file hashes, all within 10⁻¹² of the archived file.
That result decides how the references are checked: by tolerance (10⁻⁹), not by hash. A pipeline that demanded identical hashes would reject a correct run of unchanged software. The hash still has its job — it identifies the archived file, the one frozen run everybody compares against — and Chapter 29's table says which check answers which question.
Reading a Difference: Classes A, B and C
When two implementations are compared variable by variable, each variable lands in one of three classes:
| Class | Meaning | What to report |
|---|---|---|
| A | agreement at numerical precision, or exact agreement of classes | the largest difference |
| B | a bounded difference within a stated criterion | the criterion, the observed value, and the cause — or "not attributed" |
| C | a repeatable difference with no complete explanation | the measurements, what was ruled out, and where the data are |
Three kinds of criterion appear in these checks, and they are not interchangeable:
- Regression criteria are set after observing the differences, just above what was measured. They stop the documented behavior from getting worse in continuous integration; they are not evidence of equivalence.
- Equivalence tolerances justify treating two outputs as numerically the same — 10⁻⁹ for a CSV with twelve decimals, single-precision noise for 32-bit arithmetic.
- Acceptance criteria judge a run that has no reference to compare with, and are written before it (Chapters 29 and 31).
E2: Spatial Parity of the Operators
disscube-benchmark runs DisSCube pipeline files — the same format as Chapter 28 — on the raw layers of TerraME's tutorial cases, and compares every cell with the TerraME goldens. The cell below clones the release and runs the smallest case, Itaituba (31 × 20 cells of 5 km): it downloads TerraME's own input layers from a fixed commit, checks their hashes, derives eight variables, and compares them.
EVIDENCE = Path("evidence")
EVIDENCE.mkdir(exist_ok=True)

def clone(repo, tag):
    target = EVIDENCE / repo.split("/")[1]
    if not target.exists():
        subprocess.run(["git", "-c", "advice.detachedHead=false", "clone", "-q", "--depth", "1", "--branch", tag,
                        f"https://github.com/{repo}.git", str(target)], check=True)
    return target

spatial = clone("LambdaGeo/disscube-benchmark", "v1.1.0")
run = subprocess.run(["make", "benchmark", "DATASET=itaituba"], cwd=spatial, capture_output=True, text=True)
out = run.stdout
print(out[out.index("=== [2/2]"):out.index("report:")])
=== [2/2] Compare with the TerraME reference cells ===
itaituba — 620 cells, grid itaituba_5km, DisSCube 0.6.0

variable    cells  mean |err|  max |err|  bias       r       within tol      criterion            status
----------  -----  ----------  ---------  ---------  ------  --------------  -------------------  ------
elevation   620    0.889       10.1       -0.0746    0.9995  -               max <= 11            match
defor_7     620    0.00054     0.00638    -3.4e-05   1.0000  -               max <= 0.01          match
defor_87    620    0.000541    0.00638    +1.43e-05  1.0000  -               max <= 0.01          match
defor_167   620    6.49e-05    0.00395    +1.97e-05  1.0000  -               max <= 0.01          match
defor_255   620    5.15e-08    2.16e-05   -1.83e-08  1.0000  -               max <= 0.01          match
distroad    620    24          1.88e+03   -24        0.9999  94.5% (<= 100)  >= 94.0% within 100  match
distlocal   620    1.24e-06    4.96e-06   +3.28e-08  1.0000  100.0% (<= 1)   >= 100.0% within 1   match
population  620    9.08e-09    3.81e-07   -6.13e-11  1.0000  -               max <= 1e-05         match
Read the table with the classes in mind. distlocal (distance to a set of points) and population (a census count shared among cells in proportion to area) agree to numerical precision: class A. The four defor_* shares differ by less than 0.0064, the elevation by up to 10 m, the distance to roads by up to 1.9 km in a few cells: class B, each with a criterion and a cause. Across the five cases of the benchmark, 19 variables were compared: six are class A, twelve class B, and one class C.
The figure below draws four of the operators side by side on the same Itaituba cells. The two rows are not distinguishable by eye — which is what the table says, and also why the table, not the figure, is the evidence:
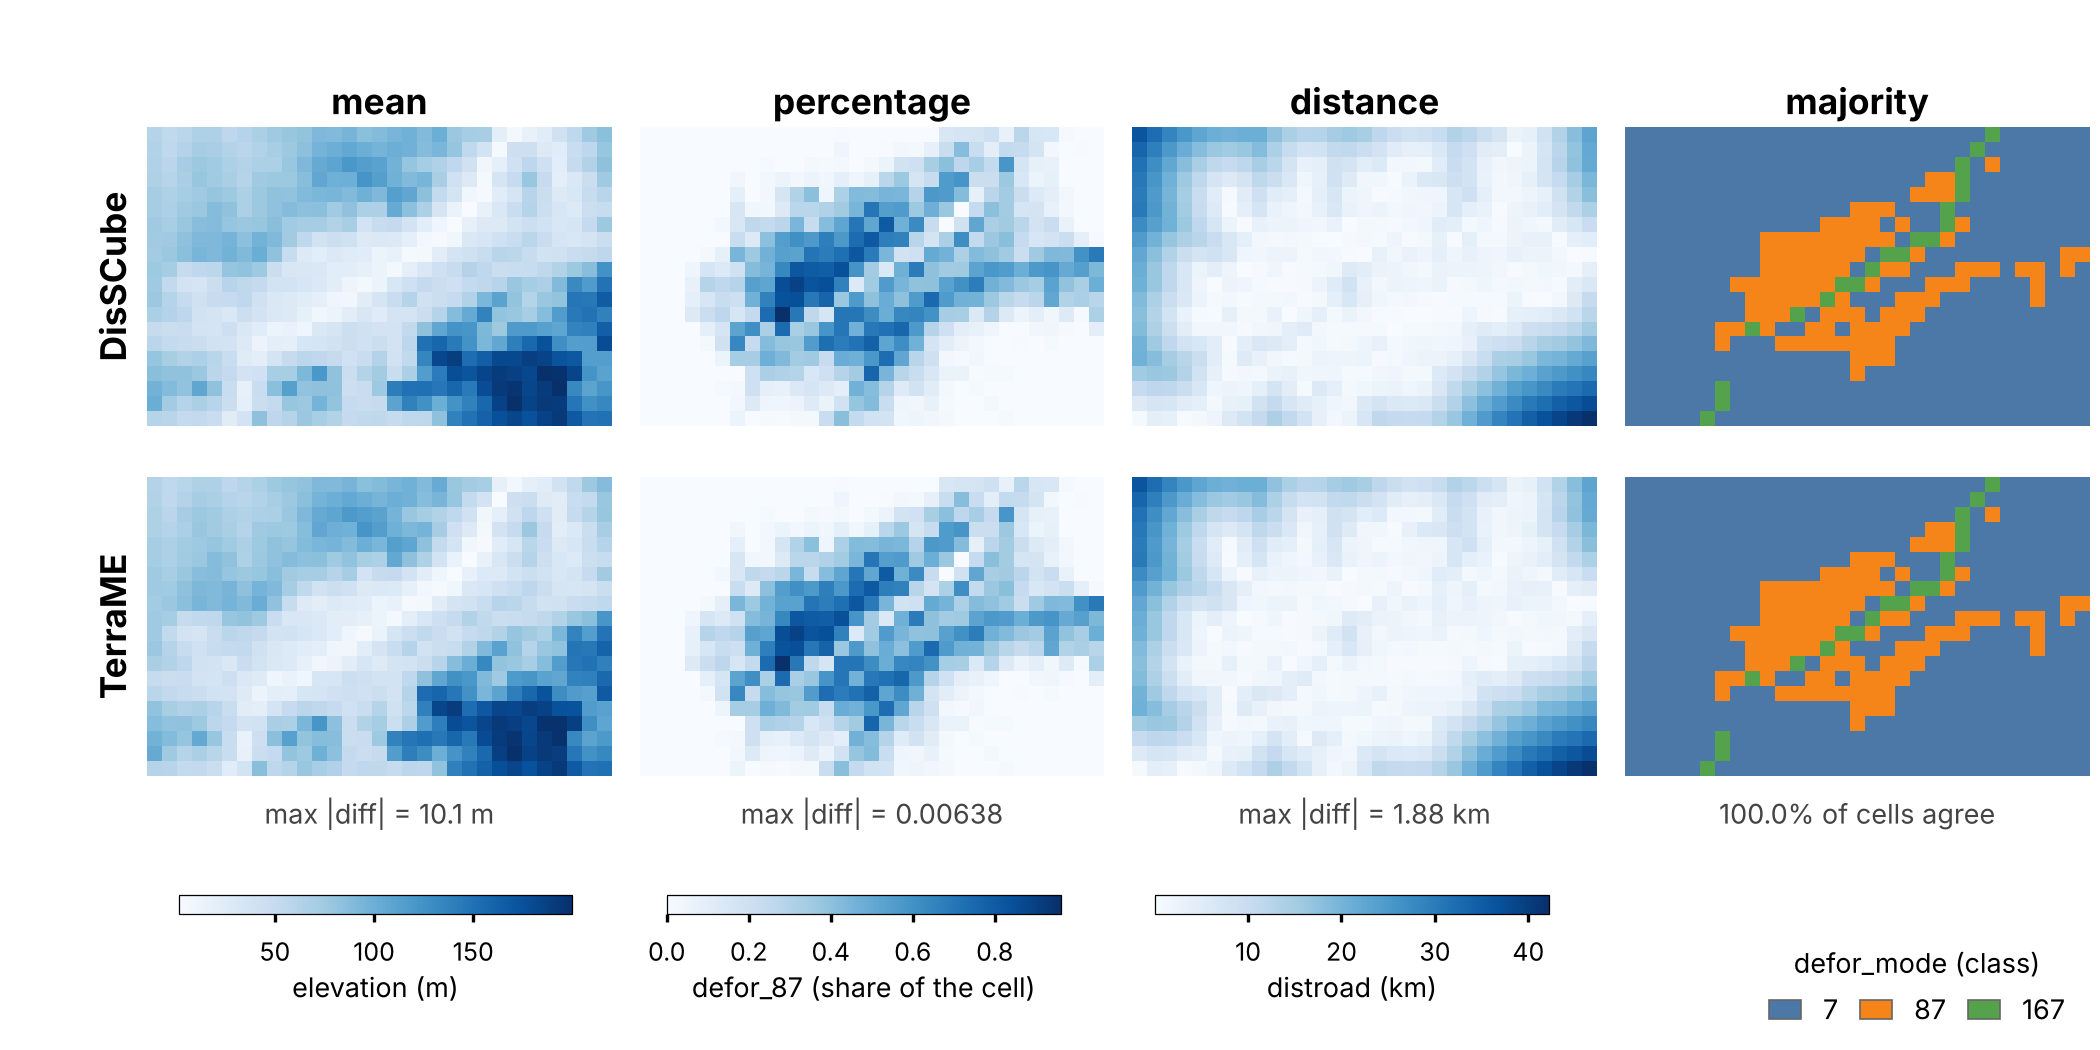
Four DisSCube operators (top row) against the TerraME fill goldens of luccme-goldens v1.1.0 (bottom row), on the Itaituba grid (31 × 20 cells of 5 km), with the same color limits: mean (elevation), percentage (share of the cell in deforestation class 87), distance (to the nearest road) and majority (predominant class). Under each column, the largest absolute difference (or the share of agreeing cells). From disscube-benchmark, benchmarks/terrame_fill/figure_operators.py. Input data: TerraME gis package (LGPL).
Why Two Correct Fills Can Differ
Every class B variable has a cause, and every cause is a choice about what an operation means that both tools make reasonably and differently:
| Operator | TerraME | DisSCube | Effect |
|---|---|---|---|
| distance to lines | from the cell center to the nearest vertex of the polyline | to the nearest point on the segment | DisSCube is never larger; the gap grows where vertices are sparse |
| mean | simple average of the pixels | area-weighted resampling | up to 10 m on a 923 m elevation raster |
| presence of lines | every cell the line touches | lines rasterized through cell centers | 0.3–1.6% of cells differ |
| coverage (share of a class) | each pixel assigned to the cell that holds its center | the raster resampled to a fine grid snapped to the cell origin | which pixels are counted changes at the edges |
| maximum, minimum | a border pixel counts for one cell | a border pixel counts for both cells | 1–1.3% of cells differ |
| area share of polygons | the intersection of every polygon is added, so overlaps count twice (values up to 1.004) | polygons merged first, overlap counted once (0 to 1) | up to 0.0044 |
The last three were not only explained but reproduced: applying TerraME's rule (pixel by center, polygons not merged) to the same inputs gives the TerraME values with zero error. That is the strongest form a class B explanation can take.
The first cause is small enough to see by hand. A road with only two vertices, far apart, and a cell center beside its middle:
from shapely.geometry import LineString, MultiPoint, Point

road = LineString([(0, 0), (10_000, 0)])        # a straight road, 10 km, with two vertices
centre = Point(5_000, 1_000)                    # a cell centre 1 km from the middle of the road

to_segment = centre.distance(road)                         # DisSCube: nearest point on the line
to_vertex = centre.distance(MultiPoint(road.coords))       # TerraME: nearest vertex
print(f"to the segment: {to_segment:7.0f} m")
print(f"to a vertex:    {to_vertex:7.0f} m")
to the segment:    1000 m
to a vertex:       5099 m
Neither number is wrong; they answer different questions. A tolerance cannot make them agree, and should not try: the right report says which definition each tool uses, and a user picks the one their model was calibrated with. This connects back to Chapter 16, where you built a distance driver by hand — and chose, without perhaps noticing, the segment definition that Shapely uses.
An Open Case: Network Cost to Ports
One variable is class C. LuccME-based models of the Amazon use the cost of reaching the nearest port along the road network, a variable defined in Aguiar's (2006) thesis and computed in TerraME by its network module (GPM). DisSCube's network_cost computes it with an exact shortest-path search over the same roads, the same 14 ports and the same cost factors. Over 14,255 cells of 25 km covering Brazil, the two agree in regional pattern — correlation 0.996 — but not cell by cell: the mean absolute difference is 27.1 km, DisSCube is lower in 85% of the cells, and only 52% are within 25 km.
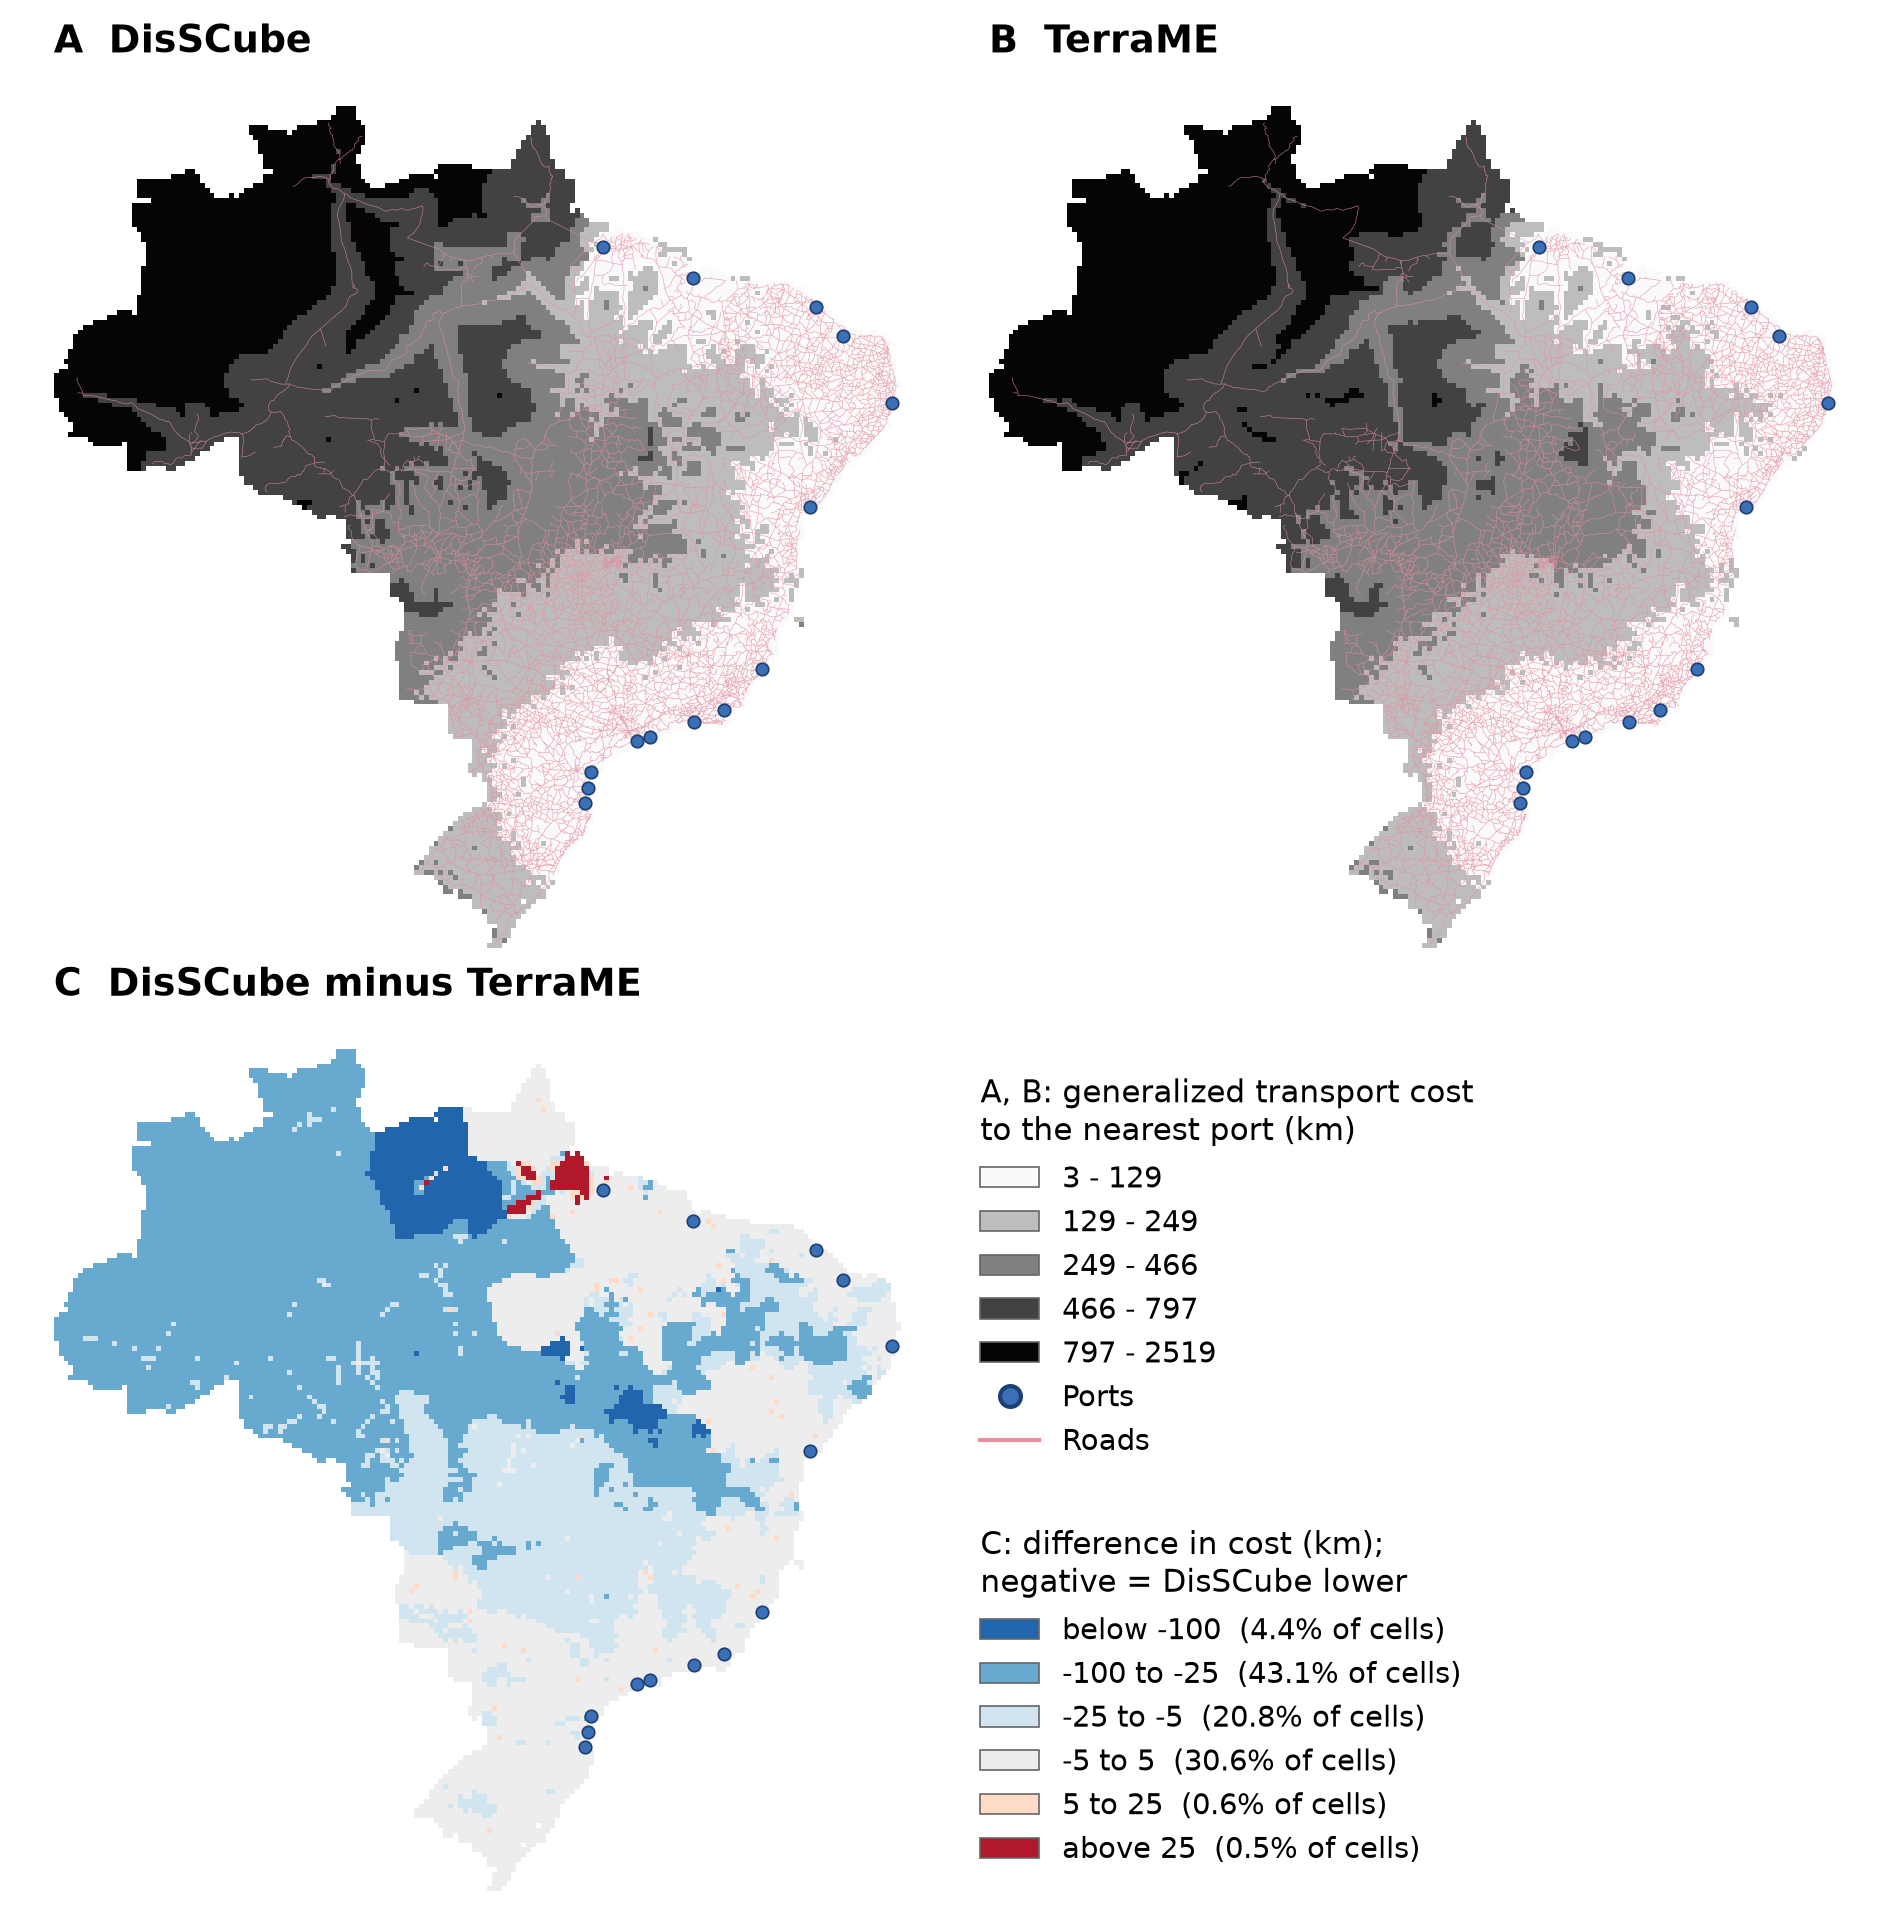
Generalized transport cost to the nearest port over Brazil, 14,255 cells of 25 km and 14 ports: (A) DisSCube 0.6.0 and (B) TerraME (golden of luccme-goldens v1.1.0), on the same cells and in the same classes (km); (C) the difference, DisSCube minus TerraME, with the share of cells in each class. From disscube-benchmark, benchmarks/terrame_fill/figure_connectivity.py. Road and port networks: TerraME gpm package.
The difference is not scattered noise. It forms regions, and it is concentrated in a few recurring offsets — −26.8 km in a fifth of the cells — which is the signature of a systematic cause. Five explanations were tested and ruled out (the topology of the road file, how adjacent lines are joined, coordinate rounding, straight-line instead of along-road length, two ports on one road). Exporting the cost of every node of TerraME's network from the reference image showed that the offset is already present along the network, not in how a cell enters it — and that, along 0.7% of the road segments, TerraME's costs are not those of a strict shortest path, with a count that depends on the order of the road features.
That might be a defect, or a property of the model as designed. The benchmark does not say which. It reports the measurements, keeps the TerraME values as the reference, publishes the data and scripts of the analysis, and leaves the question for joint work with the developers of TerraME and LuccME, whose knowledge of the network module it needs. That is what a class C report looks like: not a verdict, but a precise, reproducible description of where two implementations part ways.
E3: Dynamic Parity of the LuccME Components
disslucc-benchmark does for the dynamics what the previous section did for the data: it builds each LuccME test lab with DisSLUCC components, on the lab's own cells, runs every year, and compares the state of every cell and the number of allocation iterations with the per-year goldens. Chapter 26 gave the results; the cell below runs two of the scenarios — the discrete variant in which cells really change class, and the deliberate difference of the continuous allocation:
dynamic = clone("LambdaGeo/disslucc-benchmark", "v0.2.2")
run = subprocess.run(["python", "benchmarks/luccme_labs/run.py", "lab15_md10", "lab01/cell_correction"],
                     cwd=dynamic, capture_output=True, text=True)
print(run.stdout[run.stdout.index("disslucc "):])
disslucc 0.5.0 · dissmodel 0.6.6 · goldens: luccme-goldens v1.1.0 (c2410ce) (TerraME 2.0.1 + LuccME 3.1)

| Scenario | Lab | Cells | Years | Iterations vs TerraME | MAE (worst col.) | Max abs err | Criterion | Status |
| --- | --- | --- | --- | --- | --- | --- | --- | --- |
| `lab15_md10` | lab15_md10 | 5,914 | 1999–2004 | identical | 3.03e-08 | 1.18e-07 | iterations exact, max ≤ 1e-06 | match |
| `lab01/cell_correction` | lab01 | 6,574 | 2008–2014 | identical | 1.44e-03 | 3.94e-02 | iterations exact | differs (by design) |
lab15_md10 matches: the same iterations in every year, differences at the level of single-precision arithmetic. lab01/cell_correction is expected to differ, and the benchmark keeps it for that reason. LuccME's continuous allocation contains a correction of the change in each cell whose guard reads a misspelled field (regionregionAloc), so it never runs. DisSLUCC runs it by default and offers a switch that reproduces LuccME exactly; this scenario pins how large the deliberate deviation is, so that it can never grow unnoticed. Keeping a known difference under test is as much a part of verification as keeping agreement under test.
The benchmark is honest about its own reach, too. The ten labs as shipped accept the allocation at the first pass every year, so "identical iterations" says little there; that is why the two variants with a smaller maxDifference exist. And ten of 21 labs leaves eleven whose components DisSLUCC does not have yet — users who need those keep using LuccME.
What These Checks Show, and What They Do Not
| Check | What it allows us to state | What it does not allow |
|---|---|---|
| E1, references | The reference outputs can be regenerated within the stated tolerance. | That the references are scientifically correct. |
| E2, spatial operators | Each operator agrees with TerraME's fill to the extent measured, with every difference classified and most explained. |
That every operation is validated, or that the two are equivalent in general. |
| E3, dynamic components | The components of ten LuccME labs (and two variants) reproduce LuccME's iterations and states. | That the other eleven labs are covered, or that a model built with the components is valid. |
Two limits apply to all three. The goldens come from one TerraME run of each case; apart from the eight repeated runs of lab01 in E1, nobody has estimated how much the reference itself varies. And the checks were made by the developer of the packages; they are public so that someone else can repeat them, and that repetition is worth more than any number in this chapter.
Exercises
- Classify the Itaituba table. Using the output of the E2 cell, place each of the eight variables in class A, B or C, and for each class B variable name its cause from the table of causes.
- Reproduce a cause. Build a 2 × 1 grid of cells and one polygon that straddles their shared border, and compute the cell's
maxof a raster value both ways — the border pixel counting for one cell, and for both. Which rule gives TerraME's value? - Hash or tolerance? A colleague regenerates lab01 and reports "hash mismatch, the reference is broken." Using E1, write the two sentences you would reply with.
- Write a class C report. Pick any comparison you have run in this book (Chapter 24's sparse-matrix fire model against
FireModel, for instance) and write its report as if it were class C: what was measured, what was ruled out, where the data are. What would you need before you could move it to class A or B?
# Your code here
Summary
Key concepts introduced
- TerraME and LuccME as the reference to check against, stage by stage, with the evidence kept in separate public repositories
- A reference that can be rebuilt: a container pinned by digest (
terrame-docker) and outputs archived with hashes and DOIs (luccme-goldens) - E1: regenerating the references, and why identical software can give outputs that differ in the last printed digit — verify by tolerance, identify by hash
- Classes A, B and C, and the three kinds of criterion — regression, equivalence, acceptance — that are not interchangeable
- E2: 19 variables, six at numerical precision, twelve bounded with documented causes (vertex or segment, center or touch, simple or weighted mean, overlaps counted once or twice), one open
- The network cost to ports as a class C case, reported with what was ruled out and left for joint work with the original developers
- E3: ten LuccME labs and two variants reproduced with identical iterations, and a deliberate difference kept under test
- What each check allows us to state, and what it does not
Chapter 31 puts every piece of Part VI together in one experiment: declared open data, a DisSCube grid over Brazil, a DisSLUCC model, a record of the run, and acceptance criteria written before it ran.
Further Reading
- Costa, S. S. (2026). terrame-docker: TerraME and LuccME in a Docker image (Version 0.4.2) [Computer software]. Zenodo. https://doi.org/10.5281/zenodo.23160784
- Costa, S. S. (2026). luccme-goldens: Canonical reference execution outputs for TerraME 2.0.1 and LuccME 3.1 (Version 1.2.0) [Data set]. Zenodo. https://doi.org/10.5281/zenodo.23366244
- Costa, S. S. (2026). disscube-benchmark (Version 1.1.0) [Computer software]. Zenodo. https://doi.org/10.5281/zenodo.23366475
- Costa, S. S. (2026). disslucc-benchmark (Version 0.2.2) [Computer software]. Zenodo. https://doi.org/10.5281/zenodo.23224097
- Carneiro, T. G. S., Andrade, P. R., Câmara, G., Monteiro, A. M. V., & Pereira, R. R. (2013). An extensible toolbox for modeling nature–society interactions. Environmental Modelling & Software, 46, 104–117. https://doi.org/10.1016/j.envsoft.2013.03.002
- Aguiar, A. P. D., Carneiro, T., Andrade, P., & Assis, T. (2012). LuccME-TerraME: an open-source framework for spatially explicit land use change modelling. GLP News, 8, 21–23
- Aguiar, A. P. D. (2006). Modelagem de mudança do uso da terra na Amazônia: explorando a heterogeneidade intrarregional [Doctoral dissertation, INPE] — the original definition of the network cost to ports
- Moreira, E., Costa, S., Aguiar, A. P., Câmara, G., & Carneiro, T. (2009). Dynamical coupling of multiscale land change models. Landscape Ecology, 24(9), 1183–1194 — the generalized proximity matrix
- Mazy, F.-R., & Longaretti, P.-Y. (2023). Towards a generic theoretical framework for pattern-based LUCC modeling. Environmental Modelling & Software, 166, 105706 — why published descriptions of LUCC models are not enough to reproduce them